Remembering 1965 – the manager – Part 3

 Sabath Anthony “Sam” Mele 

 Sam Mele

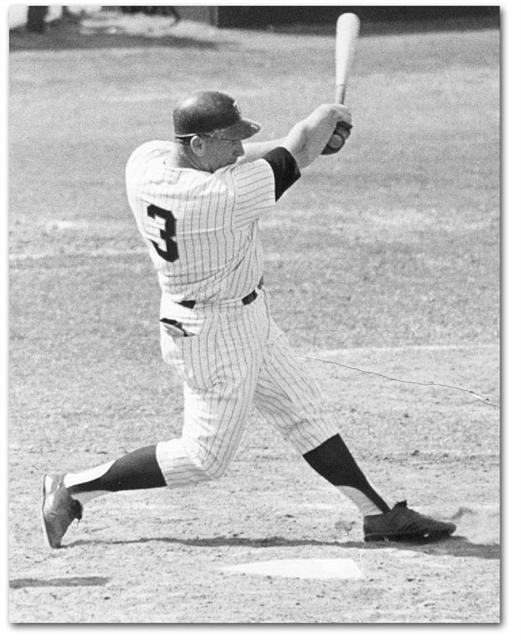
Sabath Anthony “Sam” Mele was born in Astoria, New York on January 21, 1922. Sam Mele‘s parents were born in Avellino, Italy although they met in America. Mele’s mother was sister to big league brothers Al and Tony Cuccinello. Mele, a natural all-around athlete and a Queens Park baseball legend attended New York University where he lettered in both baseball and basketball but he excelled in basketball. After his time at NYU Mele   served his country by joining the Marines during World War II. Mele however; wanted to play pro baseball and was signed as a free agent by the Boston Red Sox in 1946. In his first year of organized ball, Mele played 119 games for Scranton (A ball in the Easter League) hitting .342 with 18 home runs before being moved up to Louisville in the AAA American Association where he played all of 15 games. Mele made his major league debut with the Red Sox the following year against the Washington Senators on April 15, 1947. His rookie season may have been one of the best of his career as Sam hit 12 home runs and knocked in 73 runs in 123 games while hitting .302. Mele would never hit over .300 again in his 10 year major league career. During his playing career spanning 1947 to 1956, Mele, who batted and threw right-handed, saw duty with six major league clubs: the Boston Red Sox, Washington Senators, Chicago White Sox, Baltimore Orioles, Cincinnati Reds and Cleveland Indians, batting .267 with 80 home runs in 1,046 games. Sam Mele played his final major league game as a Cleveland Indian on September 16, 1956. Mele played AAA ball with for the White Sox and Athletics in 1957 and 1958 but never returned to the majors as a player.

Sam Mele in his playing days

Mele turned to coaching and served under manager Cookie Lavagetto in 1959 and 1960 for the Washington Senators before the team moved to Minnesota in 1961 and became known as the Twins. With the ‘61 Twins struggling, Calvin Griffith asked Lavagetto to take a week off to go fishing and clear his head in early June and during this period Mele filled in as manager. When Cookie Lavagetto was fired on June 23, 1961, Sam Mele who was 39 with no managerial experience stepped in as manager full-time and became the Minnesota Twins second manager. The Twins moved up two places in the standings under Mele, finishing seventh.

But the Twins, building with young home-grown players like future Hall of Famer Harmon Killebrew, Jim Kaat, Zoilo Versalles and Bob Allison, challenged the powerful New York Yankees in 1962 before finishing second. After finishing third in 1963, the team suffered through a poor season in 1964, leading to speculation that Mele would be replaced by his new third base coach, Billy Martin.

Finally, in 1965 the Twins broke the Yankees’ string of five World Series appearances by winning their first ever American League pennant and sent the Bronx Bombers on a tailspin where the New York Yankees would not appear in another World Series for 12 years. Led by Versalles, who was named the American League’s Most Valuable Player, batting champion Tony Oliva, and pitcher Mudcat Grant, who won 21 games, Minnesota won 102 games and coasted to the league title. The Yankees finished sixth, 25 games out. No Twins team has ever won 102 games since and Mele was named as the 1965 Sporting News Manager of the Year and back then there was only one manager of the year named for both the AL and NL. Minnesota took a two-game lead in the 1965 World Series, but the superior pitching of the Los Angeles Dodgers’ Sandy Koufax, Don Drysdale and Claude Osteen took its toll, and Los Angeles won in seven games. During the 1965 season Mele was involved in a an incident with home plate umpire Bill Valentine. The usually mild-mannered Mele’s hand apparently hit Valentine’s jaw and he was fined $500 and suspended five days.

The 1966 Twins won 13 fewer games, and ended up as runners-up to the Baltimore Orioles. Mele had clashed publicly with two of his coaches, Hal Naragon and pitching tutor Johnny Sain and both were fired after the 1966 season much to the dismay of star pitcher Jim Kaat who wrote an “open letter” to Twins fans voicing his displeasure on the Sain firing. The “letter” made national news and caused a ruckus during the 1966 World Series when major league baseball wanted the World Series front and center. The club swung a major trade for pitcher Dean Chance during the offseason and unveiled star rookie Rod Carew in 1967. Hopes and expectations were high in Minnesota, but when the Twins were only .500 after 50 games, Mele was fired. His successor was not Martin, as had been anticipated, but long time minor league manager Cal Ermer. Mele’s record as a manager was 524-436 (.546). He never managed again, but returned to the Red Sox as a scout for 25 years.

Now days Sam Mele is retired and is living in Quincy, Massachusetts. I was lucky enough to interview Sam Mele back in May of 2009 and the interview is about a 1/2 hour-long so grab the beverage of your choice, sit back, relax and listen to Sam tell you a little about himself and what it was like to manage the Minnesota Twins.

The interview with Sam Mele was done in May 2009 and is about 35 minutes long.

The Sam Mele SABR Baseball Biography is available here.

Piece by centerfieldmaz on Sam Mele

Twins and post season play

As 2014 is coming to an end it is a good time to look back on another Twins season, their fourth in a row without post season play. But you have to be a winner to make post season play and the Twins have been anything but a winner the last few years. It has been a toss-up when you try to determine who has been more inept, the Twins players on the field or the ownership and Twins executives that sit behind their desks and make the decisions that determine the experience that Twins fans will have to live with during the up-coming season.

The Twins have had many losing seasons over the years and the real core Twins fans complained but they accepted the team they had and they looked forward to the next season with renewed hope for more wins “next year”. But it is seems different now, I am not sure why, maybe the fans are more passionate, maybe it is social media that allows Twins fans to better express their frustrations but today’s Twins fans are just plain mad and disgusted with the caliber of play their home team has displayed since the 2010 ended. Hopefully the Minnesota Twins organization feels some of the passion that Twins fans have and will start to look at the product from the fans perspective and see what they can do to make the fans experience a little more fun and and not so tough on the wallet.

Since the Washington Senators moved to Minnesota after the 1960 season and became the Minnesota Twins the team has played 8,617 regular season games, winning 4,274, losing 4,335 and playing to a tie on eight occasions in 54 seasons of play. Boy, how time flies by, I still remember that 1961 season.

Looking back at Twins history they have two World Series winners and a third World Series appearance in which they lost game seven to Sandy Koufax and the Los Angeles Dodgers. In addition to the 8,617 regular season games the team has played a total of 64 post season games winning 25 and losing 39. Their last post season appearance was in 2010 and that brief playoff run lasted just three games when they were swept by the New York Yankees 3 games to zip. The teams last post season win was back in 2004 (if I am not mistaken that is about 10 years ago, YIKES!) when they beat the Yankees in game 1 of the ALDS series before losing the next three games.

So let’s take a look at the hitting and pitching statistics of the Minnesota Twins in post season play. Let’s see who stood out under the bright lights of post season play and who couldn’t or didn’t deliver when the pressure was on. The names you will see below will bring back many memories, some good, some bad, some sad and in some cases you will say “who in the hell is so and so, I don’t remember him”. But it is fun looking back.

 Hitting in Post Season (had at least one PA)

Rk Player #Matching PA ? AB R H 2B 3B HR RBI BB SO BA OBP OPS SB
1 Dan Gladden 24 115 104 17 29 6 3 1 15 9 12 .279 .348 .771 7
2 Kirby Puckett 24 109 97 16 30 3 2 5 15 8 17 .309 .361 .897 3
3 Kent Hrbek 24 103 91 10 14 1 0 3 12 11 12 .154 .252 .516 0
4 Greg Gagne 24 96 89 12 19 5 0 4 10 5 22 .213 .271 .675 0
5 Torii Hunter 21 88 80 15 24 8 1 3 8 5 11 .300 .337 .875 2
6 Jacque Jones 18 79 76 6 15 5 0 2 5 1 23 .197 .215 .557 0
7 Michael Cuddyer 21 78 74 5 25 2 1 2 8 4 18 .338 .372 .845 0
8 Corey Koskie 18 78 67 8 15 4 1 1 9 7 21 .224 .321 .679 0
9 Cristian Guzman 18 75 67 9 16 3 0 1 2 5 12 .239 .301 .630 3
10 Doug Mientkiewicz 14 56 53 4 12 1 0 2 6 3 5 .226 .268 .626 0
11 Chuck Knoblauch 12 55 46 8 15 3 0 0 5 7 5 .326 .407 .799 6
12 Harmon Killebrew 13 54 40 6 10 1 0 3 6 14 10 .250 .444 .944 0
13 Tony Oliva 13 53 51 7 16 5 0 3 5 2 10 .314 .340 .928 1
14 Gary Gaetti 12 53 47 9 13 3 1 3 9 3 8 .277 .340 .914 2
15 A.J. Pierzynski 14 50 45 6 14 0 1 2 7 4 4 .311 .360 .849 0
16 Tom Brunansky 12 50 42 10 12 4 0 2 11 8 7 .286 .400 .924 1
17 Shane Mack 11 44 41 4 9 2 1 0 4 2 11 .220 .250 .567 2
18 Luis Rivas 14 43 38 3 6 1 0 0 1 2 9 .158 .195 .379 0
19 Tim Laudner 12 43 36 5 8 2 0 1 6 7 9 .222 .349 .710 0
20 Chili Davis 11 42 35 7 9 2 0 2 6 7 11 .257 .381 .867 1
21 Brian Harper 11 41 39 3 13 4 0 0 2 2 4 .333 .366 .802 0
22 Joe Mauer 9 39 35 1 10 1 0 0 1 4 7 .286 .359 .673 0
23 Shannon Stewart 8 38 35 1 10 2 0 0 2 2 6 .286 .316 .659 1
24 Steve Lombardozzi 11 37 32 5 11 1 0 1 5 4 4 .344 .417 .885 0
25 Jason Kubel 8 32 29 0 2 1 0 0 0 3 13 .069 .156 .260 0
26 Bob Allison 10 30 26 3 2 1 0 1 3 3 10 .077 .167 .397 1
27 Zoilo Versalles 7 30 28 3 8 1 1 1 4 2 7 .286 .333 .833 1
28 David Ortiz 9 29 29 0 8 3 0 0 4 0 10 .276 .276 .655 0
29 Justin Morneau 7 29 29 4 9 3 0 2 4 0 3 .310 .310 .931 0
30 Mike Pagliarulo 11 28 26 5 8 1 0 2 5 1 4 .308 .333 .910 0
31 Matt LeCroy 10 28 26 2 7 0 0 0 1 2 9 .269 .321 .591 0
32 Denard Span 6 28 28 1 10 1 0 0 1 0 2 .357 .357 .750 1
33 Delmon Young 6 27 24 2 5 1 1 0 0 2 6 .208 .296 .630 1
34 Cesar Tovar 6 27 26 2 6 0 1 0 1 1 2 .231 .259 .567 1
35 Randy Bush 11 26 22 5 5 1 1 0 4 3 4 .227 .308 .671 3
36 Frank Quilici 9 26 22 2 4 2 0 0 1 4 4 .182 .308 .580 0
37 Leo Cardenas 6 26 24 1 4 0 1 0 1 1 8 .167 .200 .450 0
38 Don Mincher 7 25 23 3 3 0 0 1 1 2 7 .130 .200 .461 0
39 Earl Battey 7 25 25 1 3 0 1 0 2 0 5 .120 .120 .320 0
40 Nick Punto 6 25 21 0 6 1 0 0 1 3 2 .286 .375 .708 0
41 Don Baylor 7 21 18 3 7 0 0 1 4 1 1 .389 .476 1.032 0
42 Joe Nossek 6 21 20 0 4 0 0 0 0 0 1 .200 .200 .400 0
43 Rich Reese 5 21 19 0 3 0 0 0 2 2 2 .158 .238 .396 0
44 Scott Leius 9 20 18 2 5 0 0 1 2 2 3 .278 .350 .794 0
45 Rod Carew 5 17 16 0 1 0 0 0 0 1 5 .063 .118 .180 0
46 George Mitterwald 4 16 15 2 5 1 0 0 2 1 5 .333 .375 .775 0
47 Dustan Mohr 7 15 14 4 7 2 0 0 0 1 4 .500 .533 1.176 1
48 Orlando Cabrera 3 15 13 1 2 0 0 0 0 2 3 .154 .267 .421 1
49 Lew Ford 4 14 12 1 3 1 0 0 2 0 3 .250 .357 .690 1
50 Luis Castillo 3 14 11 0 3 0 0 0 0 3 3 .273 .429 .701 0
51 Jim Thome 3 13 10 2 1 0 0 0 0 2 3 .100 .308 .408 0
52 Orlando Hudson 3 13 12 2 4 0 0 1 2 0 2 .333 .333 .917 0
53 Gene Larkin 12 12 11 1 3 1 0 0 2 1 1 .273 .333 .697 0
54 Rondell White 3 12 12 1 5 1 0 1 2 0 0 .417 .417 1.167 0
55 Brendan Harris 3 12 12 1 3 0 1 0 1 0 3 .250 .250 .667 0
56 Al Newman 6 11 9 0 2 0 1 0 1 1 1 .222 .300 .744 0
57 Sandy Valdespino 5 11 11 1 3 1 0 0 0 0 1 .273 .273 .636 0
58 Danny Valencia 3 11 9 1 2 1 0 0 2 1 3 .222 .273 .606 0
59 Jason Bartlett 3 11 11 0 3 1 0 0 0 0 2 .273 .273 .636 0
60 Henry Blanco 4 10 8 1 2 0 0 1 2 0 2 .250 .222 .847 0
61 J.J. Hardy 3 10 10 0 1 1 0 0 0 0 2 .100 .100 .300 0
62 Danny Thompson 3 9 8 0 1 1 0 0 0 1 0 .125 .222 .472 0
63 Mudcat Grant 3 9 8 3 2 1 0 1 3 0 1 .250 .250 1.000 0
64 Brant Alyea 3 9 7 1 0 0 0 0 0 2 3 .000 .222 .222 0
65 Bobby Kielty 7 8 7 0 0 0 0 0 1 1 3 .000 .125 .125 0
66 Junior Ortiz 4 8 8 0 1 0 0 0 1 0 1 .125 .125 .250 0
67 Jason Tyner 2 8 6 0 0 0 0 0 0 2 2 .000 .250 .250 1
68 Jimmie Hall 2 8 7 0 1 0 0 0 0 1 5 .143 .250 .393 0
69 Jim Kaat 4 7 7 0 1 0 0 0 2 0 6 .143 .143 .286 0
70 Rick Renick 3 6 6 0 1 0 0 0 0 0 1 .167 .167 .333 0
71 Denny Hocking 3 6 6 0 3 1 0 0 1 0 1 .500 .500 1.167 0
72 Ted Uhlaender 2 6 6 0 1 0 0 0 0 0 0 .167 .167 .333 0
73 Matt Tolbert 2 6 5 0 1 0 0 0 0 0 1 .200 .333 .533 0
74 Carlos Gomez 1 6 4 1 0 0 0 0 0 1 2 .000 .333 .333 0
75 John Roseboro 2 5 5 0 1 0 0 0 0 0 0 .200 .200 .400 0
76 Jim Holt 2 5 5 0 0 0 0 0 0 0 2 .000 .000 .000 0
77 Paul Sorrento 4 4 3 0 0 0 0 0 0 1 3 .000 .250 .250 0
78 Roy Smalley 4 4 2 0 1 1 0 0 0 2 0 .500 .750 1.750 0
79 Jim Perry 2 4 4 0 0 0 0 0 1 0 1 .000 .000 .000 0
80 Paul Ratliff 1 4 4 0 1 0 0 0 0 0 1 .250 .250 .500 0
81 Dave Boswell 1 4 4 0 0 0 0 0 0 0 4 .000 .000 .000 0
82 Rich Rollins 3 3 2 0 0 0 0 0 0 1 0 .000 .333 .333 0
83 Jose Offerman 3 3 3 0 0 0 0 0 1 0 0 .000 .000 .000 0
84 Tom Prince 2 3 3 0 0 0 0 0 0 0 2 .000 .000 .000 0
85 Phil Nevin 1 3 3 0 0 0 0 0 0 0 0 .000 .000 .000 0
86 Jose Morales 1 3 3 0 0 0 0 0 0 0 2 .000 .000 .000 0
87 Sal Butera 1 3 3 0 2 0 0 0 0 0 0 .667 .667 1.333 0
88 Charlie Manuel 2 2 1 0 0 0 0 0 0 1 1 .000 .500 .500 0
89 Les Straker 1 2 2 0 0 0 0 0 0 0 2 .000 .000 .000 0
90 Jack Morris 1 2 2 0 0 0 0 0 0 0 1 .000 .000 .000 0
91 Jarvis Brown 1 2 2 0 0 0 0 0 0 0 0 .000 .000 .000 0
92 Pat Borders 1 2 2 0 0 0 0 0 0 0 1 .000 .000 .000 0
93 Bert Blyleven 1 2 1 0 0 0 0 0 0 0 1 .000 .000 .000 0
94 Jerry Zimmerman 1 1 1 0 0 0 0 0 0 0 0 .000 .000 .000 0
95 Dick Woodson 1 1 1 0 1 0 0 0 0 0 0 1.000 1.000 2.000 0
96 Stan Williams 1 1 0 0 0 0 0 0 0 1 0 1.000 0
97 Frank Viola 1 1 1 0 0 0 0 0 0 0 1 .000 .000 .000 0
98 Kevin Tapani 1 1 1 0 0 0 0 0 0 0 0 .000 .000 .000 0
99 Mike Ryan 1 1 1 0 0 0 0 0 0 0 1 .000 .000 .000 0
100 Ron Perranoski 1 1 1 0 0 0 0 0 0 0 0 .000 .000 .000 0
101 Camilo Pascual 1 1 1 0 0 0 0 0 0 0 0 .000 .000 .000 0
102 Graig Nettles 1 1 1 0 1 0 0 0 0 0 0 1.000 1.000 2.000 0
103 Tom Hall 1 1 1 0 0 0 0 0 0 0 1 .000 .000 .000 0
104 Scott Erickson 1 1 1 0 0 0 0 0 0 0 1 .000 .000 .000 0
105 Mark Davidson 1 1 1 0 0 0 0 0 0 0 0 .000 .000 .000 0
106 Rick Aguilera 1 1 1 0 0 0 0 0 0 0 0 .000 .000 .000 0
Provided by Baseball-Reference.com: View Play Index Tool Used
Generated 12/17/2014.

.

Pitching in Post Season (faced at least one batter)

Rk Player #Matching W L W-L% ERA GS CG SHO SV IP ? H ER HR BB SO WHIP
1 Jack Morris 5 4 0 1.000 2.23 5 1 1 0 36.1 35 9 1 10 22 1.24
2 Brad Radke 6 2 3 .400 3.60 6 0 0 0 35.0 37 14 6 8 17 1.29
3 Johan Santana 11 1 3 .250 3.97 5 0 0 0 34.0 35 15 2 10 32 1.32
4 Frank Viola 5 3 1 .750 4.31 5 0 0 0 31.1 31 15 3 8 25 1.24
5 Bert Blyleven 5 3 1 .750 3.18 4 0 0 0 28.1 27 10 3 5 23 1.13
6 Mudcat Grant 3 2 1 .667 2.74 3 2 0 0 23.0 22 7 3 2 12 1.04
7 Kevin Tapani 4 1 2 .333 6.04 4 0 0 0 22.1 29 15 1 5 16 1.52
8 Jim Perry 5 0 1 .000 6.75 2 0 0 0 17.1 21 13 6 6 10 1.56
9 Joe Mays 3 1 1 .500 4.76 3 0 0 0 17.0 21 9 4 2 4 1.35
10 Jim Kaat 4 1 3 .250 4.41 4 1 0 0 16.1 24 8 1 4 7 1.71
11 Eric Milton 3 1 0 1.000 1.65 2 0 0 0 16.1 13 3 2 3 9 0.98
12 Scott Erickson 3 0 0 4.91 3 0 0 0 14.2 13 8 4 9 7 1.50
13 Dave Boswell 2 0 1 .000 1.35 1 0 0 0 13.1 10 2 0 9 7 1.43
14 Carl Pavano 2 0 2 .000 4.15 2 0 0 0 13.0 15 6 3 1 12 1.23
15 Carl Willis 7 0 0 2.92 0 0 0 0 12.1 8 4 2 2 5 0.81
16 Kyle Lohse 5 0 2 .000 3.00 1 0 0 0 12.0 9 4 1 2 14 0.92
17 Les Straker 3 0 0 6.94 3 0 0 0 11.2 12 9 1 7 7 1.63
18 Rick Reed 3 0 2 .000 8.18 2 0 0 0 11.0 15 10 6 2 8 1.55
19 Juan Berenguer 7 0 1 .000 5.23 0 0 0 1 10.1 11 6 1 3 7 1.35
20 Jeff Reardon 8 1 1 .500 2.70 0 0 0 3 10.0 12 3 1 3 8 1.50
21 J.C. Romero 12 0 1 .000 5.59 0 0 0 0 9.2 10 6 1 6 7 1.66
22 Juan Rincon 8 0 0 5.19 0 0 0 0 8.2 6 5 1 6 9 1.38
23 Dan Schatzeder 5 1 0 1.000 3.12 0 0 0 0 8.2 6 3 0 3 8 1.04
24 Rick Aguilera 7 1 1 .500 1.08 0 0 0 5 8.1 7 1 0 1 6 0.96
25 Brian Duensing 2 0 2 .000 11.25 2 0 0 0 8.0 14 10 2 2 4 2.00
26 Joe Nathan 6 0 1 .000 4.70 0 0 0 1 7.2 8 4 1 6 9 1.83
27 Francisco Liriano 2 0 0 5.87 1 0 0 0 7.2 7 5 1 4 8 1.43
28 Ron Perranoski 5 0 1 .000 10.29 0 0 0 0 7.0 13 8 0 1 5 2.00
29 LaTroy Hawkins 10 1 0 1.000 6.75 0 0 0 0 6.2 9 5 0 1 11 1.50
30 Mark Guthrie 6 1 1 .500 1.35 0 0 0 0 6.2 3 1 0 4 3 1.05
31 Tom Hall 3 0 1 .000 6.00 1 0 0 0 6.0 6 4 1 4 6 1.67
32 Stan Williams 2 0 0 0.00 0 0 0 0 6.0 2 0 0 1 2 0.50
33 Boof Bonser 1 0 0 3.00 1 0 0 0 6.0 7 2 0 1 3 1.33
34 David West 4 1 0 1.000 6.35 0 0 0 0 5.2 3 4 1 8 4 1.94
35 Nick Blackburn 1 0 0 1.59 1 0 0 0 5.2 3 1 0 2 3 0.88
36 Al Worthington 3 0 0 1.69 0 0 0 0 5.1 5 1 0 2 3 1.31
37 Eddie Guardado 5 0 0 9.00 0 0 0 3 5.0 10 5 2 2 5 2.40
38 Carlos Silva 1 0 1 .000 10.80 1 0 0 0 5.0 10 6 1 0 1 2.00
39 Camilo Pascual 1 0 1 .000 5.40 1 0 0 0 5.0 8 3 0 1 0 1.80
40 Matt Guerrier 5 0 0 0.00 0 0 0 0 4.2 1 0 0 1 4 0.43
41 Steve Bedrosian 5 0 0 3.86 0 0 0 0 4.2 6 2 0 2 4 1.71
42 Jim Merritt 2 0 0 2.70 0 0 0 0 3.1 2 1 0 0 1 0.60
43 Jon Rauch 5 0 0 3.00 0 0 0 0 3.0 1 1 0 2 1 1.00
44 Terry Mulholland 1 0 0 3.00 0 0 0 0 3.0 3 1 1 0 0 1.00
45 Dick Woodson 2 0 0 10.12 0 0 0 0 2.2 5 3 0 4 2 3.38
46 Johnny Klippstein 2 0 0 0.00 0 0 0 0 2.2 2 0 0 2 3 1.50
47 Brian Fuentes 2 0 0 0.00 0 0 0 0 2.2 1 0 0 0 2 0.38
48 Grant Balfour 2 0 0 0.00 0 0 0 0 2.2 0 0 0 0 2 0.00
49 Terry Leach 2 0 0 3.86 0 0 0 0 2.1 2 1 0 0 2 0.86
50 Scott Baker 1 0 0 3.86 0 0 0 0 2.1 3 1 1 0 2 1.29
51 Jose Mijares 5 0 1 .000 4.50 0 0 0 0 2.0 1 1 1 2 0 1.50
52 Joe Niekro 1 0 0 0.00 0 0 0 0 2.0 1 0 0 1 1 1.00
53 George Frazier 1 0 0 0.00 0 0 0 0 2.0 1 0 0 0 2 0.50
54 Dean Chance 1 0 0 13.50 0 0 0 0 2.0 4 3 1 0 2 2.00
55 Michael Jackson 4 0 0 16.20 0 0 0 0 1.2 6 3 0 2 2 4.80
56 Jesse Crain 4 0 1 .000 16.20 0 0 0 0 1.2 7 3 2 1 1 4.80
57 Ron Mahay 3 0 0 5.40 0 0 0 0 1.2 0 1 0 1 2 0.60
58 Keith Atherton 3 0 0 5.40 0 0 0 0 1.2 1 1 0 1 0 1.20
59 Bob Miller 1 0 1 .000 5.40 1 0 0 0 1.2 5 1 0 0 0 3.00
60 Bill Zepp 2 0 0 6.75 0 0 0 0 1.1 2 1 1 2 2 3.00
61 Kenny Rogers 1 0 0 0.00 0 0 0 0 1.1 1 0 0 1 3 1.50
62 Tony Fiore 1 0 0 20.25 0 0 0 0 1.1 4 3 0 2 0 4.50
63 Bob Wells 2 0 0 9.00 0 0 0 0 1.0 2 1 0 0 2 2.00
64 Dennys Reyes 2 0 0 9.00 0 0 0 0 1.0 1 1 1 2 0 3.00
65 Pat Neshek 2 0 1 .000 9.00 0 0 0 0 1.0 1 1 0 0 1 1.00
66 Bill Pleis 1 0 0 9.00 0 0 0 0 1.0 2 1 1 0 0 2.00
67 Matt Capps 1 0 0 9.00 0 0 0 0 1.0 2 1 0 0 0 2.00
68 Luis Tiant 1 0 0 13.50 0 0 0 0 0.2 1 1 1 0 0 1.50
69 Joe Grzenda 1 0 0 0.00 0 0 0 0 0.2 0 0 0 0 0 0.00
70 Glen Perkins 1 0 0 0.00 0 0 0 0 0.1 2 0 0 0 0 6.00
Provided by Baseball-Reference.com: View Play Index Tool Used
Generated 12/17/2014.

Since the Twins started play in 1961 through the 2014 season a total of 751 players have put on a Minnesota Twins uniform and appeared in a game either as a hitter or a pitcher. Only 162 of them or 21.57% have appeared in a Twins post season game over the 54 seasons the Twins have called Minnesota home.

Dozier to join a select group of Twins players

When Twins second baseman Brian Dozier scores his next run he will cross home plate for the 100th time this season and become just the 13th player in Twins history to score 100 or more runs in a single season. Twins players have scored 100 runs or more in a single season 19 times. Our old buddy Chuck Knoblauch did it four times (1992, 1995-1997) and in 1996 he scored an amazing 140 runs. The last player to score 100 or more runs for Minnesota was Michael Cuddyer when he scored 102 runs in 2006. Here is the complete list through September 5, 2014.

Brian  Dozier
Brian Dozier
Rk Player R ? Year G PA AB H BB IBB SB BA OBP SLG OPS
1 Chuck Knoblauch 140 1996 153 701 578 197 98 6 45 .341 .448 .517 .965
2 Rod Carew 128 1977 155 694 616 239 69 15 23 .388 .449 .570 1.019
3 Zoilo Versalles 126 1965 160 728 666 182 41 3 27 .273 .319 .462 .781
4 Cesar Tovar 120 1970 161 726 650 195 52 5 30 .300 .356 .442 .798
5 Kirby Puckett 119 1986 161 723 680 223 34 4 20 .328 .366 .537 .903
6 Chuck Knoblauch 117 1997 156 716 611 178 84 6 62 .291 .390 .411 .800
7 Tony Oliva 109 1964 161 719 672 217 34 8 12 .323 .359 .557 .916
8 Kirby Puckett 109 1988 158 691 657 234 23 4 6 .356 .375 .545 .920
9 Tony Oliva 107 1965 149 647 576 185 55 12 19 .321 .378 .491 .870
10 Chuck Knoblauch 107 1995 136 629 538 179 78 3 46 .333 .424 .487 .911
11 Harmon Killebrew 106 1969 162 709 555 153 145 20 8 .276 .427 .584 1.011
12 Harmon Killebrew 105 1967 163 689 547 147 131 15 1 .269 .408 .558 .965
13 Lyman Bostock 104 1977 153 660 593 199 51 5 16 .336 .389 .508 .897
14 Kirby Puckett 104 1992 160 696 639 210 44 13 17 .329 .374 .490 .864
15 Chuck Knoblauch 104 1992 155 707 600 178 88 1 34 .297 .384 .358 .743
16 Bob Allison 102 1962 149 613 519 138 84 0 8 .266 .370 .511 .881
17 Michael Cuddyer 102 2006 150 635 557 158 62 5 6 .284 .362 .504 .867
18 Shane Mack 101 1992 156 692 600 189 64 1 26 .315 .394 .467 .860
19 Corey Koskie 100 2001 153 649 562 155 68 9 27 .276 .362 .488 .850
Provided by Baseball-Reference.com: View Play Index Tool Used
Generated 9/6/2014.

When Dozier joins this select list he will have the lowest batting average of any Twins player to score 100 or more runs in a season.

Twins rookies with 100 or more hits

A quick look at Twins rookies over the years and how many hits they had in their rookie season. To make the list they had to have 100 or more hits in their first season in the big leagues.

Oliva, Tony 6

Rk Player H Year Age G AB R 2B 3B HR RBI SB BA
1 Tony Oliva (RoY-1st) 217 1964 25 161 672 109 43 9 32 94 12 .323
2 Rich Rollins 186 1962 24 159 624 96 23 5 16 96 3 .298
3 Lew Ford 170 2004 27 154 569 89 31 4 15 72 20 .299
4 Kirby Puckett (RoY-3rd) 165 1984 24 128 557 63 12 5 0 31 14 .296
5 Kent Hrbek (RoY-2nd) 160 1982 22 140 532 82 21 4 23 92 3 .301
6 Chuck Knoblauch (RoY-1st) 159 1991 22 151 565 78 24 6 1 50 25 .281
7 Bernie Allen (RoY-3rd) 154 1962 23 159 573 79 27 7 12 64 0 .269
8 Luis Rivas 150 2001 21 153 563 70 21 6 7 47 31 .266
9 Rod Carew (RoY-1st) 150 1967 21 137 514 66 22 7 8 51 5 .292
10 Carlos Gomez 149 2008 22 153 577 79 24 7 7 59 33 .258
11 Tim Teufel (RoY-4th) 149 1984 25 157 568 76 30 3 14 61 1 .262
12 Joe Mauer 144 2005 22 131 489 61 26 2 9 55 13 .294
13 Zoilo Versalles 143 1961 21 129 510 65 25 5 7 53 16 .280
14 Marty Cordova (RoY-1st) 142 1995 25 137 512 81 27 4 24 84 20 .277
15 Butch Wynegar (RoY-2nd) 139 1976 20 149 534 58 21 2 10 69 0 .260
16 Bobby Darwin 137 1972 29 145 513 48 20 2 22 80 2 .267
17 Chad Allen 133 1999 24 137 481 69 21 3 10 46 14 .277
18 Jimmie Hall (RoY-3rd) 129 1963 25 156 497 88 21 5 33 80 3 .260
19 Bob Randall 127 1976 28 153 475 55 18 4 1 34 3 .267
20 Tom Brunansky 126 1982 21 127 463 77 30 1 20 46 1 .272
21 Dan Ford 123 1975 23 130 440 72 21 1 15 59 6 .280
22 Ron Washington 122 1982 30 119 451 48 17 6 5 39 3 .271
23 Cesar Tovar 121 1966 25 134 465 57 19 5 2 41 16 .260
24 Ben Revere 120 2011 23 117 450 56 9 5 0 30 34 .267
25 Gary Gaetti (RoY-5th) 117 1982 23 145 508 59 25 4 25 84 0 .230
26 Jerry Terrell 116 1973 26 124 438 43 15 2 1 32 13 .265
27 Bobby Mitchell 113 1982 27 124 454 48 11 6 2 28 8 .249
28 John Castino (RoY-1st) 112 1979 24 148 393 49 13 8 5 52 5 .285
29 A.J. Pierzynski 110 2001 24 114 381 51 33 2 7 55 1 .289
30 Willie Norwood 109 1978 27 125 428 56 22 3 8 46 25 .255
31 Mark Salas (RoY-8th) 108 1985 24 120 360 51 20 5 9 41 0 .300
32 Corey Koskie 106 1999 26 117 342 42 21 0 11 58 4 .310
33 Lyman Bostock 104 1975 24 98 369 52 21 5 0 29 2 .282
34 Dustan Mohr (RoY-8th) 103 2002 26 120 383 55 23 2 12 45 6 .269
35 Steve Lombardozzi 103 1986 26 156 453 53 20 5 8 33 3 .227
36 Rick Sofield 103 1980 23 131 417 52 18 4 9 49 4 .247
37 Denard Span (RoY-6th) 102 2008 24 93 347 70 16 7 6 47 18 .294
Provided by Baseball-Reference.com: View Play Index Tool Used
Generated 3/10/2014.

Who will be the next Twins rookie to join this list?

On This Day in Twins History – September 6, 1954

Carlos Paula
Carlos Paula

On this day in 1954 the Washington Senators played a black ballplayer for the first time. His name was Carlos Paula and he was not African American, he was from La Habana, Cuba. The 26 year-old Paula started in left field for the Senators seven years after Jackie Robinson made his major league debut. Paula went 2 for 5 with a double and knocked in 2 runs in a 8-1 win in game one of a DH against the Philadelphia A’s. The Senators lost game two by a 3-2 score at Griffith Stadium. Only 4,865 fans were on hand to witness this historic occasion.

Paula was acquired by the Washington Senators from the Paris Indians of the Big State League in an unknown transaction after the 1953 season. Paula’s major league career lasted just three seasons and 157 games, all with the Senators from 1954-1956. Paula played in the minors after that from 1957-1959 for the Philadelphia A’s, New York Yankees, New York Giants, Cincinnati Reds and Milwaukee Braves organizations but never again had a chance to play in the majors. Paula played his final season (1960) in Mexico City. Carlos Paula had a career batting average of .271 in 457 at-bats with 9 home runs and 60 RBI.

According to the SABR bio on Zoilo Versalles the Twins shortstop who was the 1965 AL MVP both he and Carlos Paula lived in the same neighborhood. As a youngster Versalles patterned his play after flashy Almendares star shortstop and active major leaguer Willy Miranda who many consider to have been the slickest fielding shortstop ever born in Cuba. Versalles also received encouragement and inspiration from another neighborhood big-leaguer, Carlos Paula, who once gave the young hopeful one of his tattered and discarded fielder’s mitts.

Only the Yankees in 1955, the Phillies in 1957, the Tigers in 1958 and the Red Sox in 1959 broke the color-line later than did the Senators/Twins franchise.

Box score game one

Box score game two

This Day in Twins History – August 29, 1963

Allison and KillebrewWhat a power packed day. In a double header with the Washington Senators in DC Stadium the Twins sweep both ends. In the first game the Twins win 14-2 and hit 8 home runs in the process. Jimmie Hall, Rich Rollins, Bernie Allen, and Bob Allison each hit one out while Vic Power and Harmon Killebrew each hit two out of the park. The Twins win the second game 10-1 and hit 4 more home runs. This time Zoilo Versalles, Jimmie Hall, Bernie Allen, and Harmon Killebrew hit’em out.

And leading off for the Twins…..

The Twins just can’t find a leadoff hitter this season. After trading both Denard Span and Ben Revere this past off-season, manager Gardenhire has been searching high and low to find someone who can fill that role. The Twins have tried 6 players leading off the game and they have all failed miserably but since someone has to hit first, Gardy has given that job to 2B Brain Dozier since July 2. During those 29 games Dozier has 135 PA’s and is hitting .258 with a .306 OBP. Not exactly all-star caliber production but it is what it is.


Twins leadoff hitters in the games first at bat

Rk I Player Year G OBP PA AB R H 2B 3B HR RBI BB SO BA OPS TB HBP ROE
1 Clete Thomas 2013 16 .313 16 14 5 3 0 0 0 0 2 3 .214 .527 3 0 1
2 Eduardo Escobar 2013 7 .286 7 6 2 1 0 0 0 0 1 1 .167 .452 1 0 0
3 Jamey Carroll 2013 25 .280 25 23 3 5 1 0 0 0 2 3 .217 .541 6 0 1
4 Brian Dozier 2013 51 .235 51 48 5 9 0 3 1 1 1 7 .188 .610 18 2 0
5 Aaron Hicks 2013 10 .200 10 8 1 0 0 0 0 0 2 6 .000 .200 0 0 0
6 Darin Mastroianni 2013 2 .000 2 2 0 0 0 0 0 0 0 0 .000 .000 0 0 0
Provided by Baseball-Reference.com: View Play Index Tool Used
Generated 8/8/2013.


How does 2013 compare to how the Twins leadoff hitters has done over the years? I know this is not probably going to shock you but the 2013 team is on a historically bad pace and if thing don’t improve quickly, this will finish as the worst OBP for a leadoff hitter in their history, even worse than the 1982 Twins who finished 60-102. A good leadoff hitter is nice to have but it certainly does not guarantee that you will be in the playoffs or even play .500 ball for that matter.

Historical Twins teams leadoff hitters in the games first at bat

Rk Year G OBP PA AB R H 2B 3B HR RBI BB SO BA OPS TB HBP ROE
1 1995 144 .507 144 120 34 49 10 2 3 3 20 21 .408 1.107 72 4 0
2 1996 162 .481 162 133 37 49 8 1 5 5 21 20 .368 1.038 74 8 2
3 1992 162 .414 162 144 41 49 9 2 5 5 16 27 .340 .948 77 2 5
4 1970 162 .407 162 151 40 55 9 3 1 1 11 10 .364 .891 73 0 0
5 1994 113 .398 113 95 25 27 6 1 4 4 18 16 .284 .893 47 0 1
6 1987 162 .383 162 141 29 41 10 0 3 3 20 23 .291 .808 60 1 3
7 1977 161 .379 161 143 37 43 5 3 1 1 18 12 .301 .777 57 0 5
8 1997 162 .370 162 140 38 38 4 2 3 3 20 23 .271 .763 55 2 0
9 2009 163 .362 163 142 26 38 4 1 3 3 21 19 .268 .735 53 0 1
10 1990 162 .358 162 151 37 47 6 2 2 2 8 23 .311 .775 63 3 3
11 1976 162 .358 162 148 33 44 6 1 1 1 14 10 .297 .730 55 0 1
12 1966 162 .358 162 150 28 46 8 3 0 0 9 24 .307 .758 60 3 2
13 1973 162 .352 162 146 27 41 8 3 2 2 16 24 .281 .770 61 0 2
14 2005 162 .352 162 150 19 45 6 1 1 1 10 17 .300 .725 56 2 2
15 1969 162 .352 162 146 36 41 9 1 3 3 15 11 .281 .770 61 1 4
16 1998 162 .352 162 150 24 45 7 2 2 2 10 28 .300 .765 62 2 2
17 1971 160 .350 160 149 21 45 6 1 0 0 10 5 .302 .706 53 1 2
18 2002 161 .348 161 153 29 48 12 2 11 11 8 33 .314 .982 97 0 4
19 1975 159 .346 159 143 24 39 9 0 0 0 16 14 .273 .682 48 0 1
20 1999 161 .342 161 147 29 41 9 2 5 5 13 24 .279 .811 69 1 1
21 1978 162 .340 162 146 28 39 7 0 2 2 16 23 .267 .696 52 0 1
22 1980 161 .335 161 151 28 44 6 2 2 2 10 11 .291 .733 60 0 3
23 1967 164 .335 164 150 36 41 12 2 2 2 12 17 .273 .755 63 2 2
24 1989 162 .333 162 143 32 35 4 1 1 1 17 17 .245 .641 44 2 3
25 1986 162 .333 162 151 28 43 5 2 6 6 8 23 .285 .797 70 3 1
Rk Year G OBP PA AB R H 2B 3B HR RBI BB SO BA OPS TB HBP ROE
26 2004 162 .333 162 153 24 45 6 0 6 6 8 16 .294 .784 69 1 1
27 2000 162 .327 162 149 32 40 10 4 3 3 13 27 .268 .777 67 0 1
28 1993 162 .321 162 153 21 43 1 0 1 1 7 20 .281 .628 47 2 3
29 2010 162 .321 162 144 28 34 9 1 1 1 16 18 .236 .654 48 2 2
30 2007 162 .321 162 147 23 37 4 1 0 0 15 17 .252 .614 43 0 4
31 2006 162 .321 162 145 22 35 4 0 1 1 17 21 .241 .611 42 0 2
32 2001 162 .321 162 146 19 36 7 3 4 4 15 24 .247 .739 61 1 0
33 1968 162 .321 162 147 27 37 7 0 2 2 10 13 .252 .661 50 5 1
34 1962 163 .319 163 143 29 32 5 1 1 1 17 13 .224 .613 42 3 1
35 1961 161 .317 161 148 25 38 9 0 1 1 13 18 .257 .655 50 0 2
36 2011 162 .315 162 148 29 37 3 3 1 1 14 22 .250 .646 49 0 2
37 1972 154 .312 154 142 25 36 3 1 0 0 9 9 .254 .600 41 3 3
38 2003 162 .309 162 153 28 41 9 1 6 6 9 28 .268 .766 70 0 3
39 1964 163 .307 163 151 31 38 9 2 3 3 9 23 .252 .704 60 3 0
40 1985 162 .302 162 149 25 36 6 1 0 0 13 18 .242 .598 44 0 2
41 2012 162 .302 162 152 22 39 9 1 1 1 10 15 .257 .651 53 0 0
42 2008 163 .301 163 147 25 33 5 1 2 2 16 27 .224 .614 46 0 2
43 1974 163 .301 163 148 25 34 5 1 3 3 12 19 .230 .638 50 3 5
44 1963 161 .298 161 154 24 41 8 2 5 5 7 15 .266 .740 68 0 1
45 1984 162 .296 162 154 27 40 2 1 1 1 7 17 .260 .601 47 1 1
46 1979 162 .296 162 150 22 36 4 1 0 0 12 16 .240 .576 42 0 1
47 1981 110 .291 110 103 17 25 1 1 1 1 7 16 .243 .592 31 0 0
48 1983 162 .290 162 153 24 38 5 0 4 4 8 19 .248 .650 55 1 2
49 1991 162 .278 162 149 23 32 3 1 3 3 12 21 .215 .587 46 1 1
50 1988 162 .272 162 155 25 37 8 0 5 5 7 19 .239 .659 60 0 2
Rk Year G OBP PA AB R H 2B 3B HR RBI BB SO BA OPS TB HBP ROE
51 1965 162 .265 162 153 29 34 13 1 2 2 8 31 .222 .625 55 1 3
52 1982 162 .253 162 151 12 30 2 0 0 0 11 29 .199 .465 32 0 0
53 2013 111 .252 111 101 16 18 1 3 1 1 8 20 .178 .529 28 2 2
Provided by Baseball-Reference.com: View Play Index Tool Used
Generated 8/8/2013.


Let’s take a look at some of the Twins best ever leadoff hitters and see who had the best years and when they had them. I don’t think there is much question that Chuck Knoblauch was the best leadoff hitter the team has ever had.

Best Twins leadoff hitters in the games first at bat

Chuck Knoblauch

Rk I Player Year G OBP PA AB R H 2B 3B HR RBI BB SO BA OPS
1 Chuck Knoblauch 1995 134 .500 134 111 32 44 9 2 2 2 19 20 .396 1.068
2 Chuck Knoblauch 1996 151 .497 151 125 36 49 8 1 5 5 18 19 .392 1.089
3 Cesar Tovar 1970 156 .417 156 145 39 54 9 3 1 1 11 10 .372 .913
4 Chuck Knoblauch 1997 155 .374 155 134 36 37 4 2 3 3 19 21 .276 .777
5 Jacque Jones 2002 132 .364 132 124 27 40 10 2 11 11 8 26 .323 1.065
6 Denard Span 2009 143 .364 143 125 20 34 4 0 2 2 18 17 .272 .716
7 Cesar Tovar 1971 142 .359 142 133 19 42 6 1 0 0 8 4 .316 .735
8 Denard Span 2010 151 .338 151 133 27 33 8 1 1 1 16 17 .248 .684
9 Lenny Green 1962 149 .315 149 133 25 31 5 1 1 1 13 13 .233 .624
10 Kirby Puckett 1985 160 .300 160 148 25 36 6 1 0 0 12 18 .243 .597
11 Zoilo Versalles 1965 155 .258 155 148 27 33 12 1 2 2 6 30 .223 .616
Provided by Baseball-Reference.com: View Play Index Tool Used
Generated 8/8/2013.


Here we are looking at the Twins best players leading off in any inning. I know a good leadoff hitter is important but when you look at the numbers over an entire season and the number of times that the leadoff hitter actually leads off any inning, I think you will find that none of them even average two leadoff plate appearances a game. I think the best you will find on the list below is about 1.97 per game.

Rk I Player Year G OBP PA AB R H 2B 3B HR RBI BB SO BA OPS
1 Chuck Knoblauch 1996 152 .462 288 242 65 87 15 5 8 8 35 38 .360 1.024
2 Chuck Knoblauch 1995 136 .458 240 202 52 72 13 5 4 4 32 32 .356 .988
3 Shane Mack 1992 133 .413 213 189 52 64 14 1 7 7 19 34 .339 .948
4 Kirby Puckett 1986 147 .385 270 253 58 87 12 2 10 10 13 29 .344 .911
5 Cesar Tovar 1970 156 .376 303 277 67 88 17 4 3 3 23 17 .318 .817
6 Denard Span 2009 144 .369 260 230 43 66 6 1 4 4 30 38 .287 .743
7 Chuck Knoblauch 1997 156 .368 272 242 59 70 9 3 4 4 27 34 .289 .768
8 Cesar Tovar 1971 147 .365 271 257 49 85 12 3 0 0 13 10 .331 .766
9 Denard Span 2010 151 .361 277 242 50 65 12 3 1 1 32 37 .269 .716
10 Zoilo Versalles 1966 130 .347 236 217 36 63 14 2 1 1 15 31 .290 .735
11 Jacque Jones 2002 135 .345 232 220 49 68 18 2 13 13 12 49 .309 .931
12 Lenny Green 1962 151 .336 298 268 52 70 12 2 5 5 26 18 .261 .712
13 Cesar Tovar 1968 142 .333 255 234 43 64 13 3 3 3 14 14 .274 .726
14 Zoilo Versalles 1964 137 .322 242 225 42 61 12 3 8 8 14 27 .271 .780
15 Kirby Puckett 1985 161 .320 300 282 42 78 10 3 1 1 18 31 .277 .664
16 Dan Gladden 1988 130 .315 248 230 46 60 12 1 6 6 17 29 .261 .715
17 Cesar Tovar 1967 136 .311 241 223 48 57 11 3 2 2 15 16 .256 .670
18 Cesar Tovar 1972 131 .311 238 221 43 57 8 1 0 0 14 15 .258 .614
19 Zoilo Versalles 1965 157 .285 284 267 54 64 20 3 2 2 14 47 .240 .645
Provided by Baseball-Reference.com: View Play Index Tool Used
Generated 8/8/2013.


They went down swinging

Harmon Killebrew

Hitters with 500 are more career strikeouts as Twins

Rk Player SO From To Age G PA AB R H HR BA OPS
1 Harmon Killebrew 1314 1961 1974 25-38 1939 8018 6593 1047 1713 475 .260 .901
2 Kirby Puckett 965 1984 1995 24-35 1783 7831 7244 1071 2304 207 .318 .837
3 Gary Gaetti 877 1981 1990 22-31 1361 5459 4989 646 1276 201 .256 .744
4 Torii Hunter 870 1997 2007 21-31 1234 4894 4492 672 1218 192 .271 .793
5 Bob Allison 842 1961 1970 26-35 1236 4643 3926 648 999 211 .254 .840
6 Justin Morneau 806 2003 2013 22-32 1243 5199 4607 654 1285 211 .279 .833
7 Michael Cuddyer 805 2001 2011 22-32 1139 4555 4072 606 1106 141 .272 .794
8 Kent Hrbek 798 1981 1994 21-34 1747 7137 6192 903 1749 293 .282 .848
9 Jacque Jones 737 1999 2005 24-30 976 3786 3492 492 974 132 .279 .782
10 Rod Carew 716 1967 1978 21-32 1635 6980 6235 950 2085 74 .334 .841
11 Greg Gagne 676 1983 1992 21-30 1140 3697 3386 452 844 69 .249 .677
12 Corey Koskie 647 1998 2004 25-31 816 3257 2788 438 781 101 .280 .836
13 Tony Oliva 645 1962 1976 23-37 1676 6880 6301 870 1917 220 .304 .830
14 Roy Smalley 606 1976 1987 23-34 1148 4676 3997 551 1046 110 .262 .750
15 Zoilo Versalles 606 1961 1967 21-27 1065 4500 4148 564 1046 86 .252 .686
16 Tom Brunansky 589 1982 1988 21-27 916 3760 3313 450 829 163 .250 .782
17 Tim Laudner 553 1981 1989 23-31 734 2268 2038 221 458 77 .225 .682
18 Joe Mauer 552 2004 2013 21-30 1157 4972 4300 677 1389 102 .323 .873
19 Jason Kubel 532 2004 2011 22-29 753 2846 2559 334 694 104 .271 .794
20 Randy Bush 505 1982 1993 23-34 1219 3481 3045 388 763 96 .251 .747
Provided by Baseball-Reference.com: View Play Index Tool Used
Generated 7/25/2013.

They came to play

The major league baseball season is a real grind, you are scheduled to play 162 games in about 185 days give or take and that includes travel time. I am not even going to mention spring training and the post season. Many of us go to work Monday through Friday but we usually have week-ends off and a few holiday scattered in to re-charge our batteries. Once the baseball season starts the player’s life is totally baseball, don’t get me wrong, I am not saying that playing baseball is tougher than a normal job that we all do, I am just saying that it is not as easy as many of us would like to think. I know, I know, we would all still gladly trade places with any player out there.

Baseball is a marathon, you need to keep chugging along, working through illness and injury while you strive for peak performance and you do this in front of the general public and all the writers and reporters that are out there every day looking for something they can put on TV or in the paper. Ability is critical but if your team doesn’t also have durability you are probably headed for a long season.

The Baltimore Orioles Cal Ripken Jr. holds the major league record for consecutive games played with 2,632 in a streak that started on May 30, 1982 and ended on September 19, 1998. Think about that, every game from 1982 to 1998, an amazing streak and a record I am sure will never be broken.

Justin MorneauSo that takes me to why I am writing this post, what is the Minnesota Twins record for most consecutive games played and who holds the record? The Twins have played in Minnesota for 52 years and yet the Twins record for consecutive games played stands at 319, a far cry from 2,632. I think many of you will be surprised to learn that the Minnesota Twins consecutive games played record holder is still playing for the Twins today and is none other than Justin Morneau, yes the same guy that has not played more than 135 games since 2008. Let’s take a look at the Twins six longest consecutive games played streaks and see who owns them. Some of the “gamers” on this list will probably surprise you.

  1. 319 games – Justin Morneau (1B/DH) – Streak started on June 29, 2007 and ended on June 20, 2009.
  2. 249 games – Harmon Killebrew (3B/1B, and OF) – Streak started on September 21, 1965 and ended on July 4, 1967.
  3. 245 games – Harmon Killebrew (3B/1B) – Streak started on September 23, 1968 and ended on July 7, 1970.
  4. 230 games – Gary Gaetti (3B/OF) – Streak started on September 29, 1983 and ended on June 22, 1985.
  5. 210 games – Roy Smalley (Shortstop) – Streak started on April 6, 1979 and ended on June 2, 1980. Smalley’s streak would actually have stood at 254 and in second place on this list had he not chose to sit out the last day of the 1978 season.
  6. 203 games – Cesar Tovar (played all over) – Streak started on September 4, 1966 and ended on May 4, 1968.

In the Twins 52 year history only 5 players have appeared in every game that the Twins played that particular season so it is a fairly rare occurrence with only one player accomplishing this feat twice. The most recent occurrence was Justin Morneau appearing in all 163 games in 2008 and that was 24 years after Gary Gaetti appeared in all 162 games in 1984. In 1979 Roy Smalley played in all 162 games, Harmon Killebrew did it twice playing in 162 games in 1966 and again in 1969 and Cesar Tovar played in all 164 games in 1967.

The list of players that have led the Twins in games played over the years is an interesting list indeed. Who has led the Twins in games played the most frequently? That would be Kirby Puckett who did it eight times including five years in a row.

2012 – Joe Mauer played in 147 of a possible 162 games.

2011 – Danny Valencia played in 154 of a possible 162 games.

2010 – Michael Cuddyer played in 157 of a possible 162 games.

2009 – Michael Cuddyer played in 153 of a possible 163 games.

2008 – Justin Morneau played in all 163 games.

2007 – Torii Hunter played in 160 of a possible 162 games.

2006 – Justin Morneau played in 157 of a possible 162 games.

2005 – Lew Ford played in 147 of a possible 162 games.

2004 – Lew Ford played in 154 of a possible 162 games.

2003 – Torii Hunter played in 154 of a possible 162 games.

2002 – Jacque Jones played in 149 of a possible 161 games.

2001 – Luis Rivas & Corey Koskie played in 153 of a possible 162 games.

2000 – Cristian Guzman & Matt Lawton played in 156 o fa possible 162 games.

1999 – Todd Walker played in 143 of a possible 161 games.

1998 – Matt Lawton played in 152 of a possible 162 games.

1997 – Chuck Knoblauch played in 156 of a possible 162 games.

1996 – Paul Molitor played in 161 of  a possible 162 games.

1995 – Karby Puckett & Marty Cordova played in 137 of a possible 144 games.

1994 – Chuck Knoblauch played in 109 of a possible 113 games.

1993 – Kirby Puckett played in 156 of a possible 162 games.

1992 – Kirby Puckett played in 160 of a possible 162 games.

1991 – Chili Davis played in 153 of a possible 162 games.

1990 – Gary Gaetti played in 154 of a possible 162 games.

1989 – Kirby Puckett played in 159 of a possible 162 games.

1988 – Kirby Puckett played in 158 of a possible 162 games.

1987 – Kirby Puckett played in 157 of a possible 162 games.

1986 – Kirby Puckett played in 161 of a possible 162 games.

1985 – Kirby Puckett played in 161 of a possible 162 games.

1984 – Gary Gaetti played in all 162 games.

1983 – Gary Gaettti and Gary Ward played in 157 of a possible 1962 games.

1982 – Gary Ward played in 152 of a possible 162 games.

1981 – John Castino  played in 101 of a possible 110 games.

1980 – John Castino played in 150 of a possible 161 games.

1979 – Roy Smalley played in all 162 games.

1978 – Roy Smalley played in 158 of a possible 162 games.

1977 – Rod Carew played in 155 of a possible 161 games.

1976 – Rod Carew played in 156 of a possible 162 games.

1975 – Rod Carew played in 143 of a possible 159 games.

1974 – Rod Carew played in 153 of a possible 163 games.

1973 – Rod Carew played in 149 of a possible 162 games.

1972 – Bobby Darwin played in 145 of a possible 154 games.

1971 – Cesar Tovar played in 157 of a possible 160 games.

1970 – Cesar Tovar played in 161 of a possible 162 games.

1969 – Harmon Killebrew played in all 162 games.

1968 – Cesar Tovar played in 156 of a possible 162 games.

1967 – Cesar Tovar played in all 164 games.

1966 – Harmon Killebrew played in all 162 games.

1965 – Zoilo Versalles played in 160 of a possible 162 games.

1964 – Tony Oliva played in 161 of a possible 163 games.

1963 – Zoilo Versalles played in 159 of a possible 161 games.

1962 – Zoilo Versalles played in 160 of a possible 163 games.

1961 – Bob Allison played in 156 of a possible 162 games.

When I looked back over the entire franchise history going back to 1901 for the Washington Senators I found that there was a true “iron man”  who currently stands number 9 on the MLB all-time consecutive games played list with 829 games. Senators 3B Eddie Yost started his streak on August 30, 1949 and he played in every game through May 11, 1955. That is a lot of games.

Prince FielderThe current active MLB consecutive game streak is in the firm grasp of Detroit Tiger 1B Prince Fielder who stands at 343 and counting. Actually Fielder has missed just 1 game (September 13, 2010) since September 3, 2008 and if he had not skipped that game due to a stomach virus his streak would be at 669 today. The man has been in the big leagues since 2005 and full time since 2006. Since 2006 he has played in 157, 158, 159, 162, 161, 162, and 162 games. An amazing streak for a man his size.